Below is the list of courses available for registration through Tulsa Community College Continuing Education. It is easy to register. Peruse the list of available courses. When you find one you like, click the Register button. You will complete a short registration form, make your payment, and Voilá! You are registered!
SEARCH TIP: You can search the web catalog by searching on course key word or title and location!
Course title example: Spanish Location example: Southeast, Online, etc.
View All Classes CLASSES BY CAMPUS TCC CE Online Course
Southeast Northeast West Metro Riverside Community
CLASSES BY SUBJECT
RETURN TO TCC Continuing Education Main Page
MEETING DAYS & TIMES: Saturday, 10:00AM-12:00PMLOCATION: Northeast Campus, Room AB 143INSTRUCTOR: Anne Alwill
This course explores the science and practice of composting as a sustainable way to improve soil health and reduce organic waste. Students will learn how biological, chemical, and physical processes transform organic materials into nutrient-rich compost, and how this benefits soil structure, fertility, and microbial life.
Through hands-on activities, students will design and manage composting systems for a variety of settings, from backyard bins to larger-scale operations. Topics include soil testing, nutrient cycling, carbon sequestration, and integrating compost use into regenerative agriculture and garden management.
10/03/2026
Northeast
Not Available
-
MEETING DAYS & TIMES: Thursday, 6:00PM-8:00PM-2 Sessions, September 10, 2026 & September 17, 2026 LOCATION: Southeast Campus, Building 3, Room 3210INSTRUCTOR: Kathy Stewart
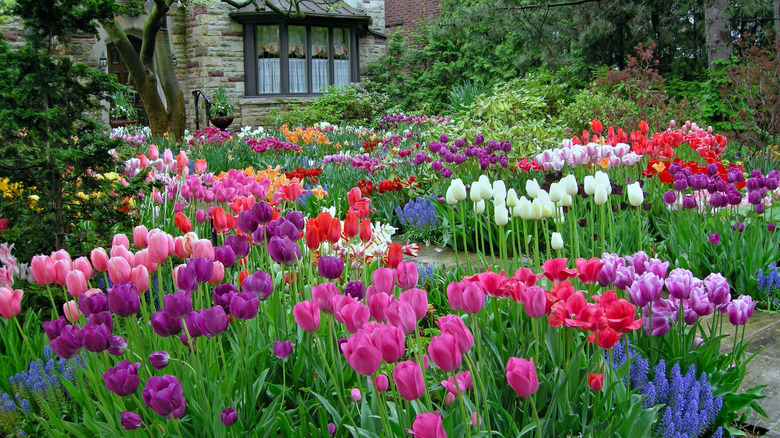
Get ready to transform your garden into a vibrant spring showcase. This course covers everything you need to know about planting bulbs—especially tulips and perennial favorites—for reliable, beautiful blooms year after year. Whether you’re working with a backyard garden, raised beds, or containers, you’ll learn practical techniques that take the guesswork out of bulb planting.
You’ll learn how to choose quality bulbs, prepare soil, and determine proper planting times, depth, and spacing. Special focus is given to tulips and hardy perennials, including how to combine them for continuous color and care for them after blooming so they return stronger each spring.
By the end, you’ll have a clear seasonal plan and the confidence to plant and maintain thriving bulbs.
09/03/2026
09/10/2026
Southeast
18-AUG-22 - 30-JUN-23
Ready To Enroll
Back Checkout